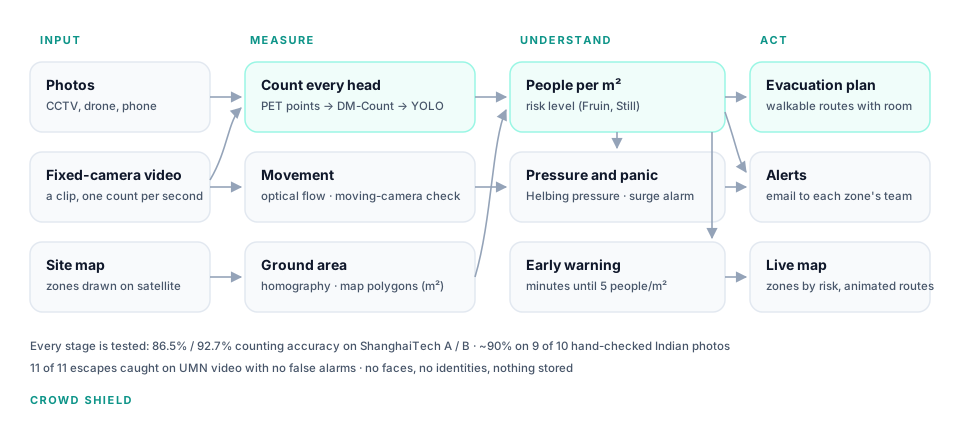
Crowd Shield counts every head in CCTV, drone and phone images, turns the count into people per square metre on a satellite map, watches camera feeds for zones filling up or surging, and plans where to move people. These are the warning signs crowd-safety research says appear minutes before a crush.
This is the working system, not a recording. Count a crowd photo, run the Kumbh and Madurai site maps, or see how accurate it is.
Runs on free hosting. If nobody has used it for a while it is asleep: press Yes, get this app back up if you see it, and give it about a minute.
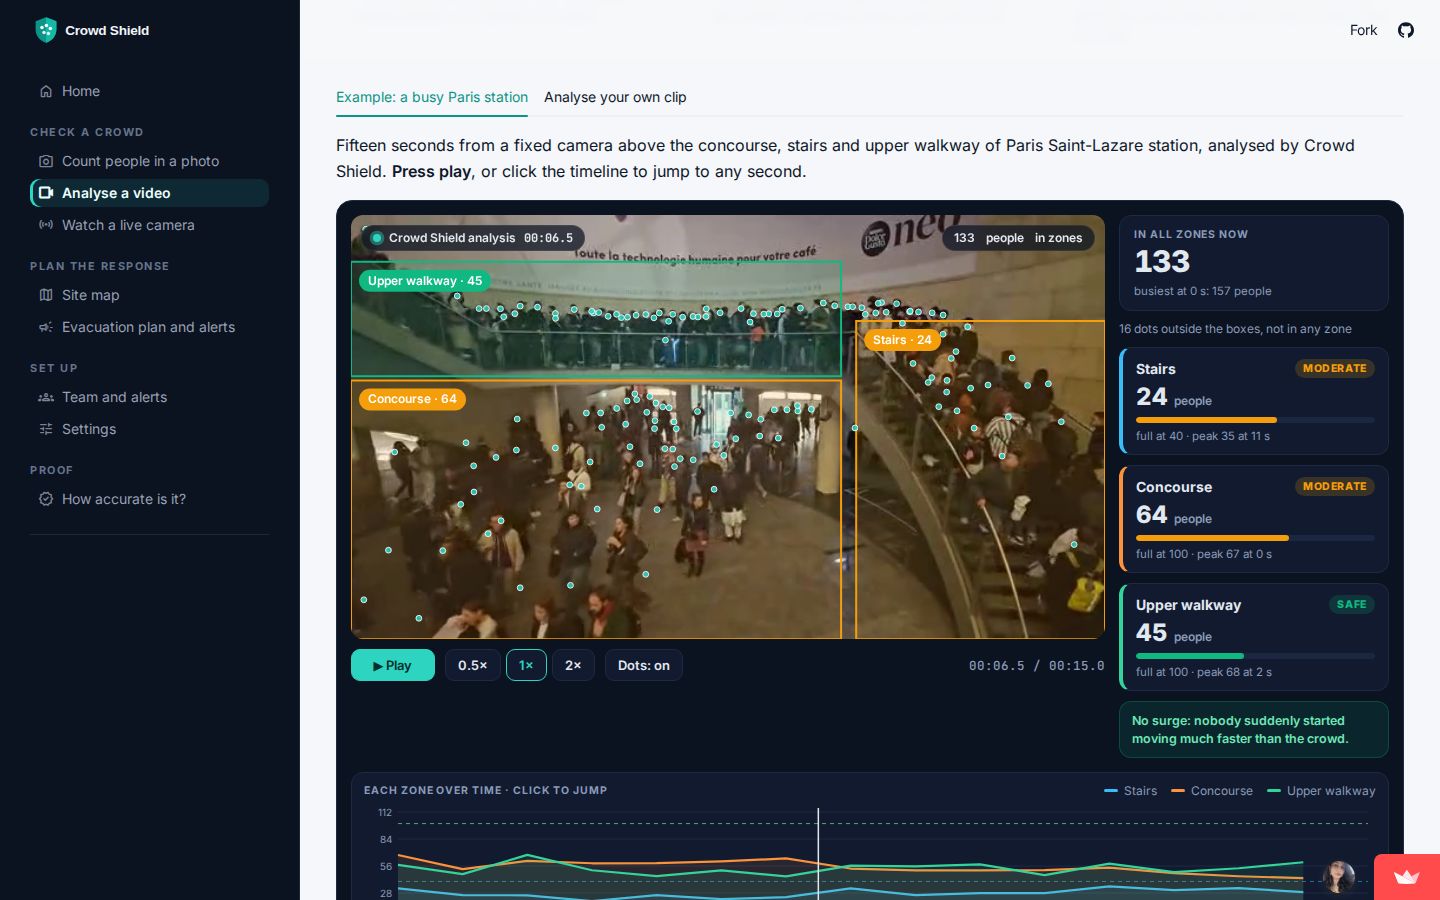
Every head marked, zones turning amber and red as they fill, and each zone over time.
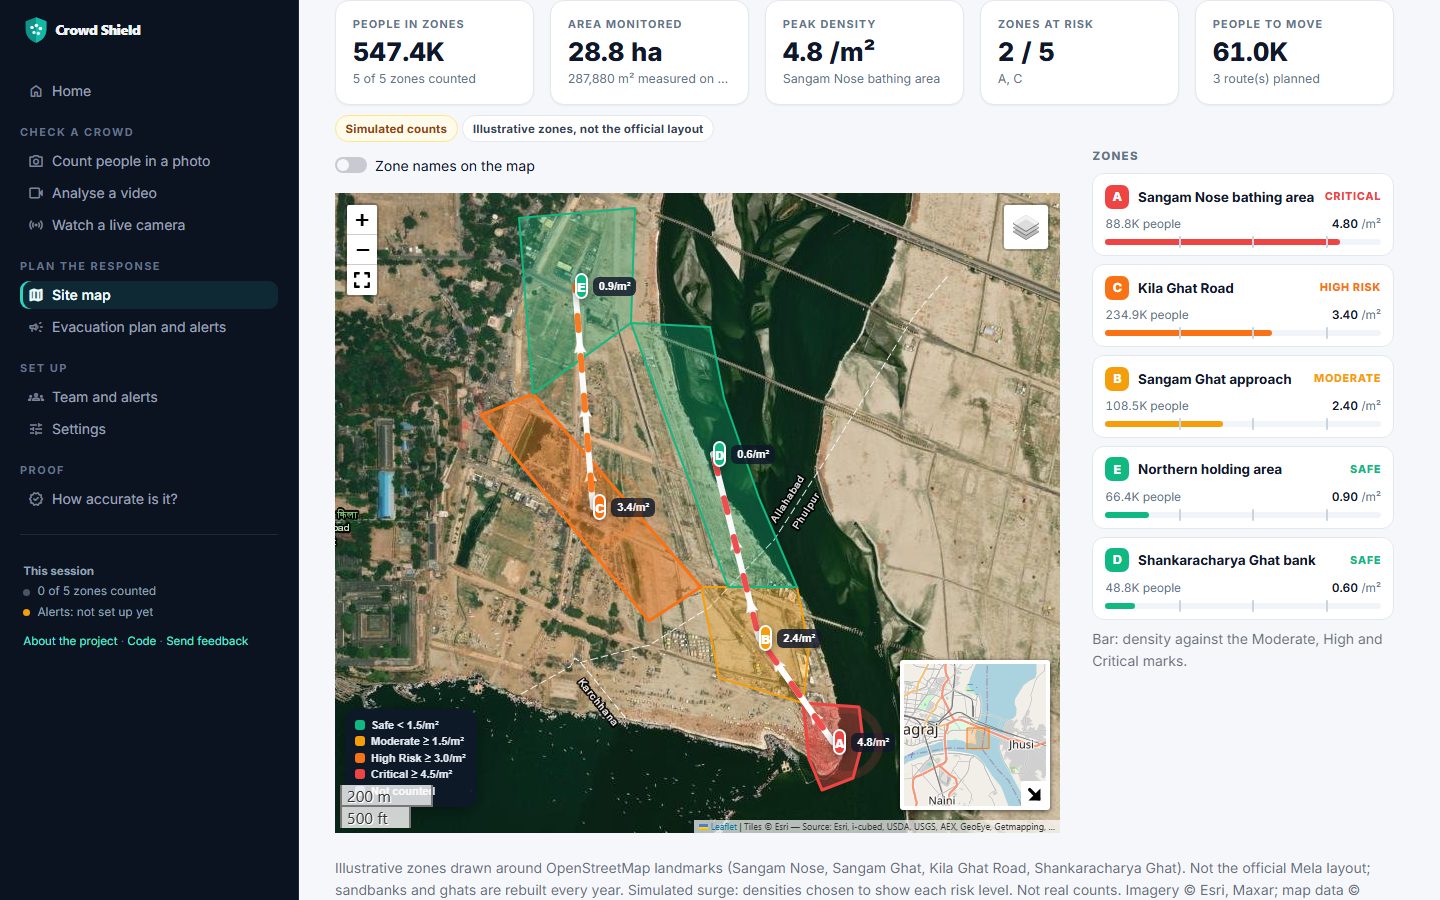
Zones on satellite imagery of the Sangam, people per m², and walking routes to move people.
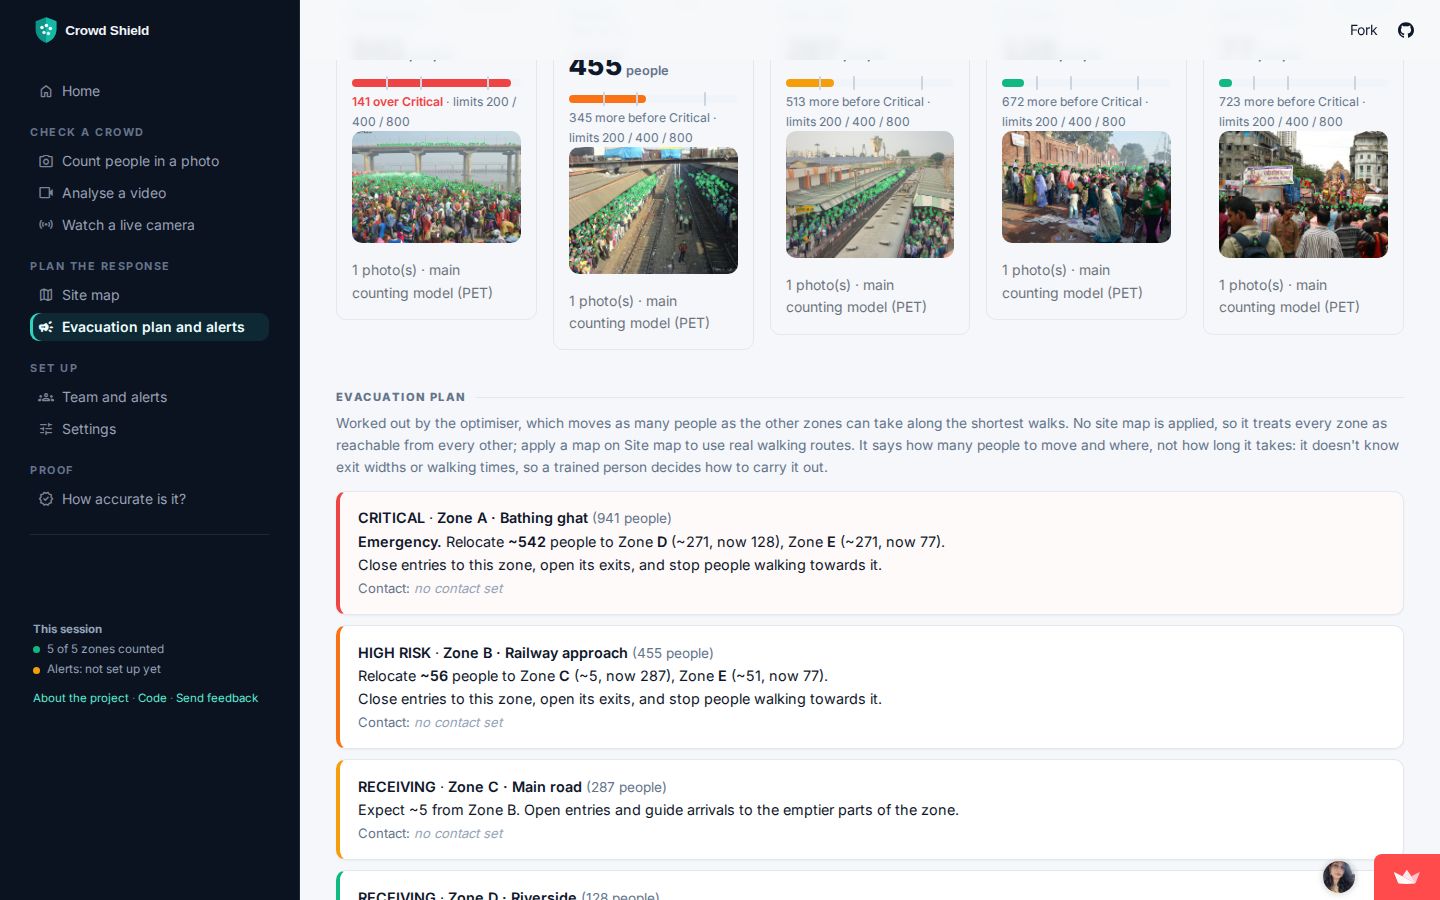
Each zone against its limits, and orders for every zone's team (example numbers).
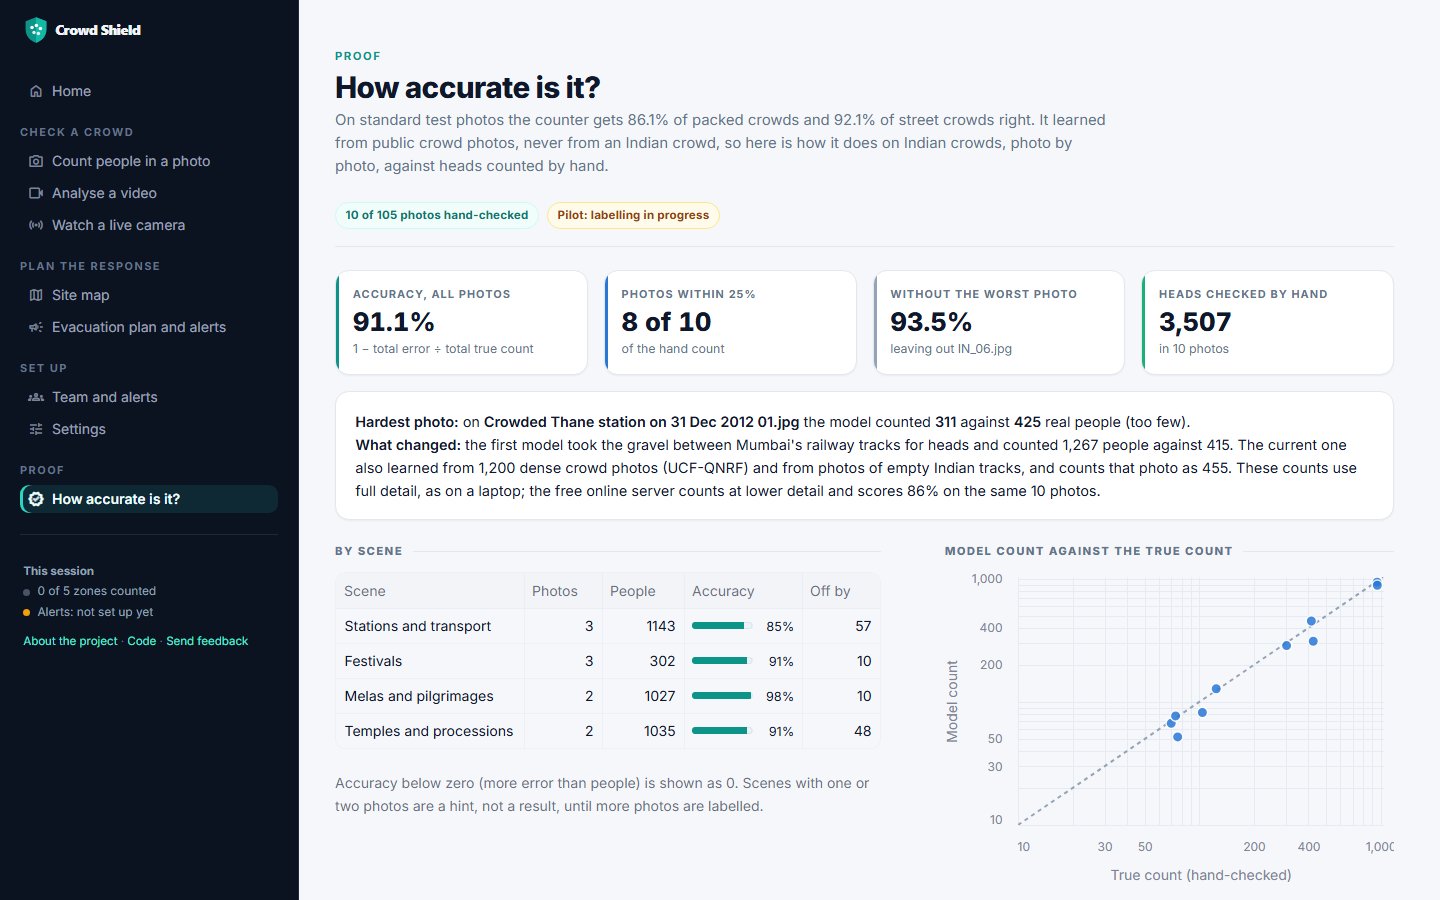
Every hand-counted Indian photo, with the model's count and the true one.
In a crush, people die standing up, squeezed until they can't breathe. Density and pressure build for minutes before that happens. Crowd Shield measures both, using cameras that are already there.
On the Mauni Amavasya bathing day, barricades gave way near the Sangam Nose and the crowd surged (Uttar Pradesh Police).
More than five lakh people gathered for Lord Kallazhagar's entry into the Vaigai river, and a crush broke out on the riverbank (police reports).
A head count alone can't tell you if a crowd is dangerous. You also need the ground area.
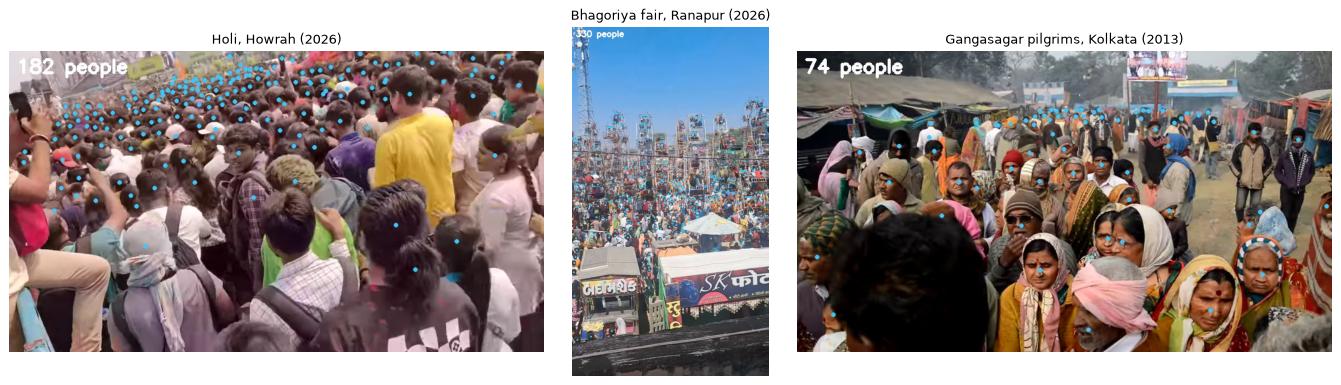
A point model (PET) puts a dot on each head, even where bodies overlap. A density model and YOLO are the fallbacks.
Zones drawn on satellite imagery give the real area in m², and a ground calibration does the same for a camera view.
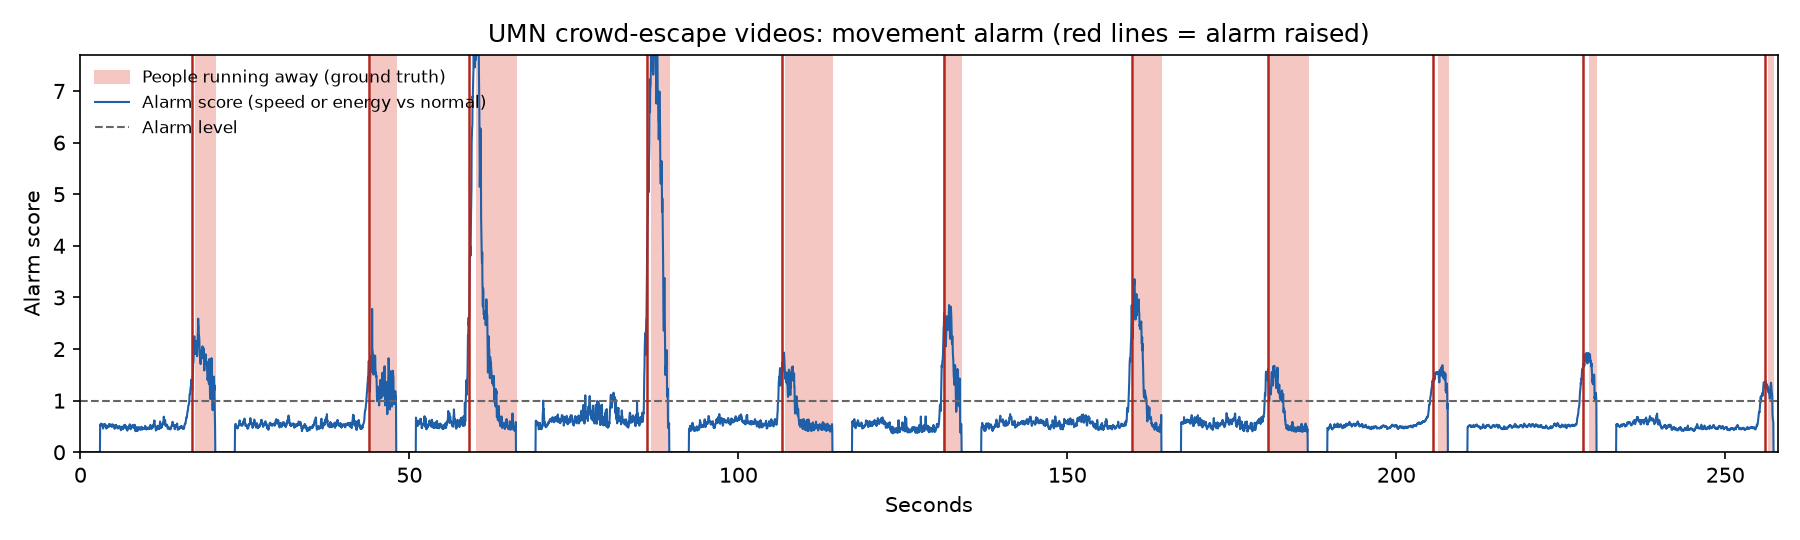
Density sets the risk level. On video, optical flow tracks speed and crowd pressure, and an alarm fires on a sudden surge.
An optimiser plans where to move people, only along routes they can walk and without overfilling any zone, and alerts each zone's team by Telegram or email.
Two of India's biggest gatherings, with zones drawn on satellite imagery. The colours show a simulated surge using the Fruin "standard" thresholds. In the app, live counts fill these zones and animated arrows show where to move people.
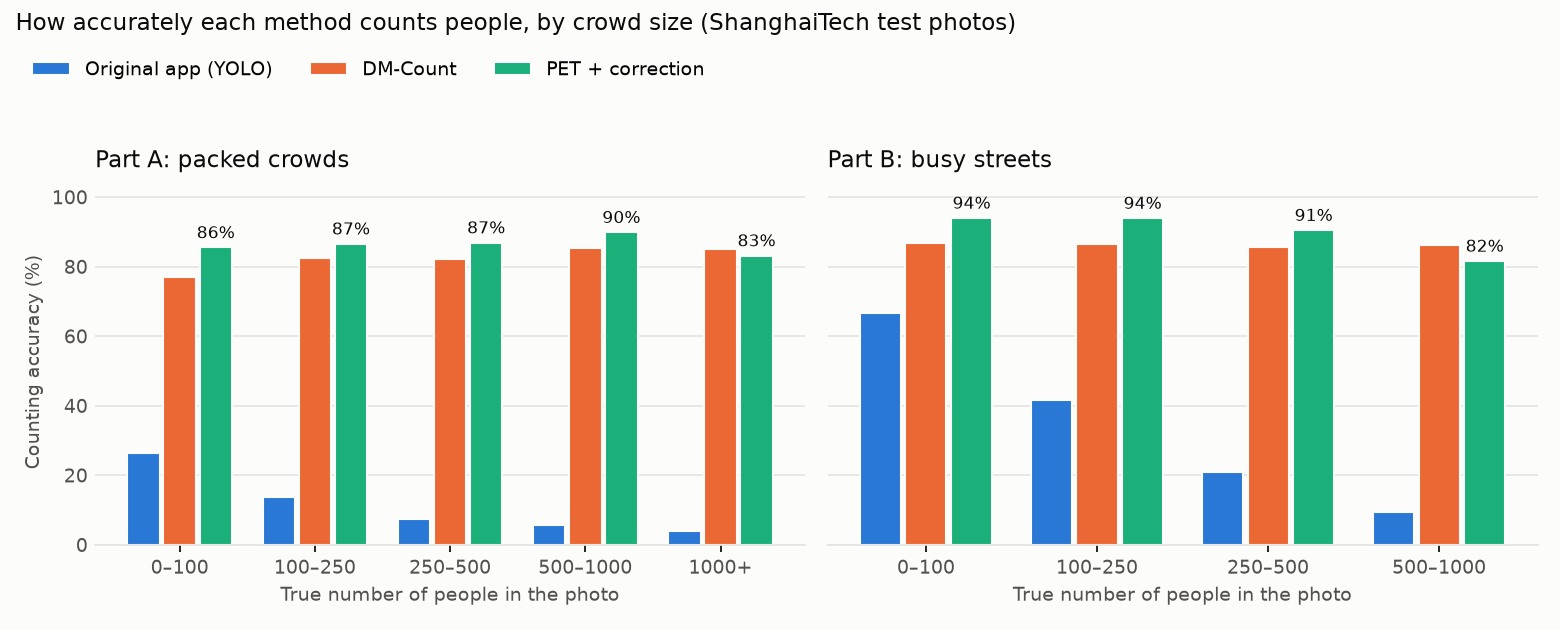
Tested on held-out data only: no model was picked using the test images. Accuracy = 1 − total counting error ÷ total true count.
| Method | Packed (A) | Streets (B) |
|---|
PET holds up on large crowds of over 1,000 people. It is weaker on small groups: two of the 10 pilot photos were 21% and 32% off. When the app can't tell how much ground a photo covers, it says Unknown instead of Safe.
The alarm fires a median of 0.7 s before the labelled start of the panic. It held up when each scene was left out in turn while tuning: lawn 2/2, indoor 6/6, plaza 3/3.
All freely licensed from Wikimedia Commons, with credits. On the first 10 hand-checked photos the first model scored 66.7%, because it took railway gravel for heads. The second, also trained on 1,200 dense crowd photos and on empty Indian tracks, scores 91% (86% on the free online server).
A safety tool that hides its failures is dangerous. These are published in full.
From above, railway ballast reads as a sea of heads: 1,267 counted where there were 415. Retraining fixed that photo but hurt the others, so I kept the better model and documented the failure.
All 15 freely licensed Indian crowd clips I found were filmed handheld, so speed readings measured the camera, not the crowd. The app now detects a moving camera and hides motion results instead of guessing.
On a plain 4-core CPU, PET takes about 16 s per photo. The free server has 3.2 GB, so it counts big photos in overlapping pieces: same accuracy, about 30 seconds each. A live feed is recounted every 30 s or more; video-rate analysis would need a GPU.
Counting works on handheld Indian clips (Holi in Howrah, Bhagoriya, Gangasagar). Motion analysis needs a fixed camera, such as CCTV.